Market Connection: May 2024 Market Outlook and Report

What you really need to know about home prices
According to recent data from Fannie Mae, almost 1 in 4 people still think home prices are going to come down. If you’re one of the people worried about that, here’s what you need to know.
A lot of that fear is probably coming from what you’re hearing in the media or reading online. But here’s the thing to remember. Negative news sells. That means, you may not be getting the full picture. You may only be getting the clickbait version. As Jay Thompson, a Real Estate Industry Consultant, explains: “Housing market headlines are everywhere. Many are quite sensational, ending with exclamation points or predicting impending doom for the industry. Clickbait, the sensationalizing of headlines and content, has been an issue since the dawn of the internet, and housing news is not immune to it.”
Here’s a look at the data to set the record straight.
Home Prices Rose the Majority of the Past Year
Case-Shiller releases a report each month on the percent of monthly home price changes. If you look at their data from January 2023 through the latest numbers available, here’s what you’d see:
Case-Shiller: Prices
Month-over-month percent changes in home values (Seasonally Adjusted)
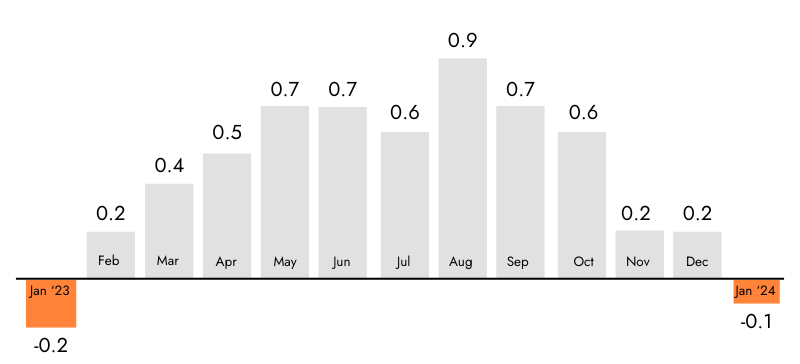
What do you notice when you look at this graph? It depends on what color you’re more drawn to. If you look at the orange, you’ll see that home prices rose for the majority of the past year.
But if you’re drawn to the gray, you may only focus on the two slight declines. This is what a lot of media coverage does. Since negative news sells, drawing attention to these slight dips happens often. But that loses sight of the bigger picture.
Here’s what this data really says: There’s a lot more gray in that graph than orange. And even for the two orange bars, they’re so slight, they’re practically flat. If you look at the year as a whole, home prices still rose overall.
It’s perfectly normal in the housing market for home price growth to slow down in the winter. That’s because fewer people move during the holidays and at the start of the year, so there’s not as much upward pressure on home prices during that time. That’s why even the green bars toward the end of the year show smaller price gains.
The overarching story is that prices went up last year, not down.
To sum all that up, the source for that data in the graph above, Case Shiller, explains it like this: “Month-over-month numbers were relatively flat,
However, the annual growth was more significant for both indices, rising 7.4 percent and 6.6 percent, respectively.”
One of the best examples is 1503 Ralston Avenue, Belmont. It closed 130+% over asking, nearly $800k (confirm), and had a super short time on the market. On the surface, there's a lot that you might think would deter a buyer: an out-dated interior on Ralston, which is a main road. But there is a pool and a mostly flat yard. Belmont is also a bit of a sleepy town, and while it's beloved for its schools and some neighborhoods see fierce competition, this isn't where we would expect to see that. The answer might lie in inventory. Belmont is only second to San Bruno in lacking inventory for the last 6 months.
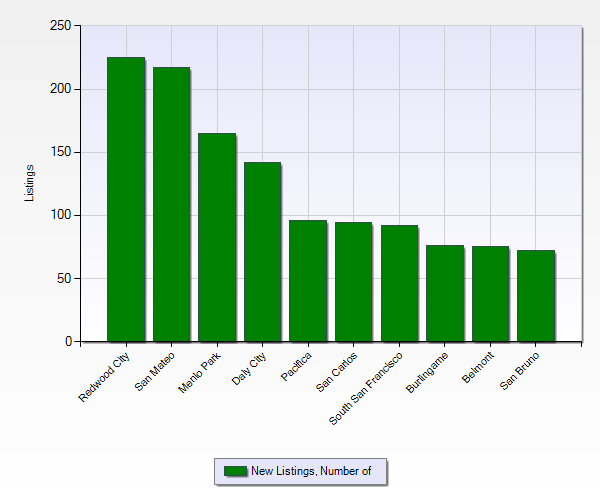
In addition to that, there are 611 Santa Susana Avenue, Millbrae, and 819 Robin Ln., Millbrae. Both are Millbrae, and in the last two weeks, they have had the two highest overbids in the county. This aligns with what we are seeing on the ground: Millbrae, which is always a favorite among buyers because of its location, schools, and beautiful parks, has emerged as a highly competitive market in the last couple months.
So, if you find yourself among the many who are concerned about the trajectory of home prices, remember this: while sensational headlines may grab attention, they often fail to provide the full context. The reality is that when we examine the data objectively, it tells a different story. Yes, there may be occasional dips in the market, but overall, the trend is upward. Take, for example, the Case-Shiller data, which illustrates that home prices have predominantly risen over the past year. Even during slower months, such as winter, where there may be a temporary plateau, the overall trajectory remains positive.
As you navigate through the sea of headlines and opinions, remember to focus on the facts, not the fear. Real estate markets can be complex, but with a clear understanding of the data and trends, you can make informed decisions for your future.

MY TAKE
Caroline's take on the latest market trends
When considering home prices, it's crucial to look beyond the alarming headlines and focus on the data. Sensational media coverage can often skew perception, but the reality is more nuanced. Despite occasional dips, the overall trend for home prices remains upward.
Real-life examples, like those in Belmont and Millbrae, demonstrate the strong demand in desirable areas with limited inventory. As you navigate the housing market, prioritize the facts and trends over fear-driven news. By staying informed, grounded, and patient, you can navigate the real estate journey with confidence.
Contact us today to discuss your specific situation and develop a personalized strategy to achieve your real estate goals.
Market Report May 2024
Here's the latest May 2024 Market Update showing year-over-year data. The data includes all Single-family homes, condos & Townhomes in the California Area sourced from MLS Listings for the period from May 2023 thru May 2024. This may include preliminary data and may vary from the time this data was gathered. All data is deemed reliable but not guaranteed. Content from this article is courtesy of Keeping Current Matters.
FOR NEWS INQUIRIES
Kyle Henry
Director of Marketing
Kyle.H@CarolineHuo.com
650.727.1308
Share & Stay in the Know